收藏
笔记
反馈
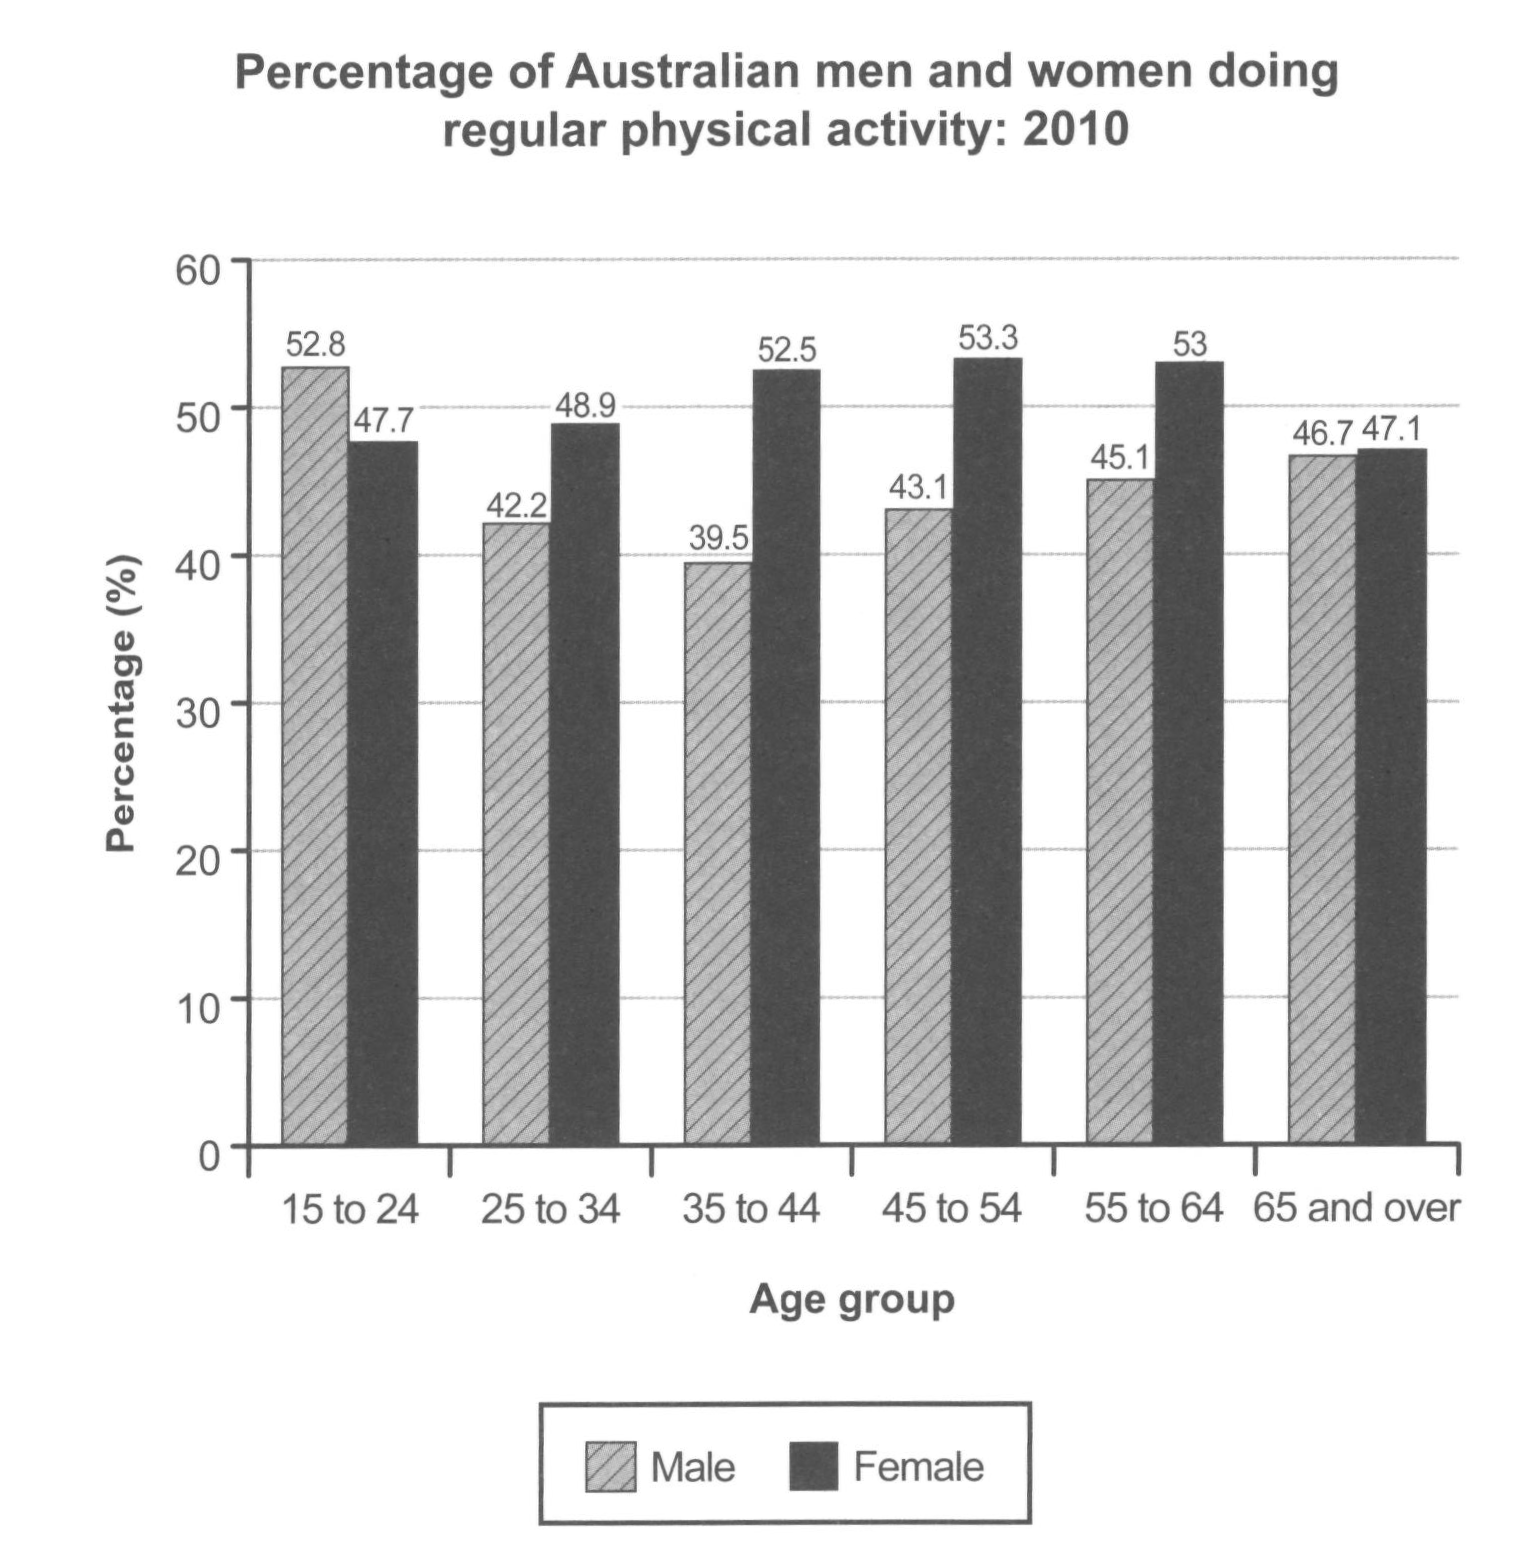
The bar chart below shows the percentage of Australian men and women in different age groups who did regular physical activity in 2010.
Summarise the information by selecting and reporting the main features, and make comparisons where relevant.
Write at least 150 words.